
Fuelics
Platform
At NimaProject, we designed the Fuelics platform: the web and mobile apps that monitor fuel tanks, water networks, power meters, parking and air quality through battery-powered sensors. We led the research, information architecture and UI, and built one design system for web, iOS and Android, so a technician on site and a manager in the office use the same product, available in three themes.
- Project
- Fuelics – IoT Monitoring Platform
- Year
- 2024 – Ongoing
- Industry
- IoT, Energy & Utilities
- Service
- UX/UI Design, Product Design, Design System
- Our Role
- UX Research, Information Architecture, UI Design, Prototyping, Design System
- Link
- fuelics.com

2,000+
Active edge sensors
70+
Enterprise and municipal clients
6
Countries deployed
< 1 year
Since the full platform launch
The Challenge
Fuelics began as a fuel tank monitor. As it grew into water, power, parking and air quality, its single-purpose interface couldn’t keep up: navigation was rigid, data was hard to reach, and every new sensor was squeezed into screens built for tanks. The new platform had to serve two opposite users: managers watching whole networks from the office, and technicians configuring sensors in the field.

The Approach
We started from the people at both ends: how technicians install and maintain sensors on site, and how managers monitor, group and share them from the office. That research shaped two apps on one design system, mobile for the field and web for the office, and the six decisions that follow.


In the Field ・ The Mobile App
Built for technicians on site, often underground and offline.
Pairing that works in the field
One-tap Bluetooth pairing passed in the lab, then broke on site with weak signal and complex industrial sensors.
So we created a step-by-step wizard with Automatic and Manual on every step, and offline queuing that syncs later.
Designing for sleeping hardware
Sensors sleep to save battery, so changes can’t arrive instantly, and two users could edit the same sensor at once.
So we added an amber Pending state that shows every waiting change, locks the field and rolls up into badges.





In the Office ・ The Web Platform
Built for managers watching whole networks from one screen.
One sensor, two mental models
Managers don’t want baud rates and device IDs, and technicians can’t troubleshoot from business charts, yet both look at the same sensor.
So we split navigation into Assets, what a sensor measures, and Devices, how the hardware runs.
Six-month gaps, many contractors
Sensors are visited every 3–6 months and are hard to find again, and contractors should see only part of the network.
So we added timestamped installation photos to every device, and permissions that combine an access scope with a role.



One Language, Three Themes
One visual language for thousands of sensors and every screen.
2,000 sensors, no visual fatigue
One sensor type can monitor a tank, a pipe or a manhole, and IDs alone made them impossible to tell apart.
So we gave each sensor family a planetary name, a constellation icon and its own colour, everywhere.
Accessible, tactile neumorphism
IoT dashboards feel like spreadsheets, and ours had to work in bright sun and on night shifts.
So we built a tactile system with 15.7:1 text contrast, beyond WCAG AAA, in Neu, Night and Earth themes across web, iOS and Android.


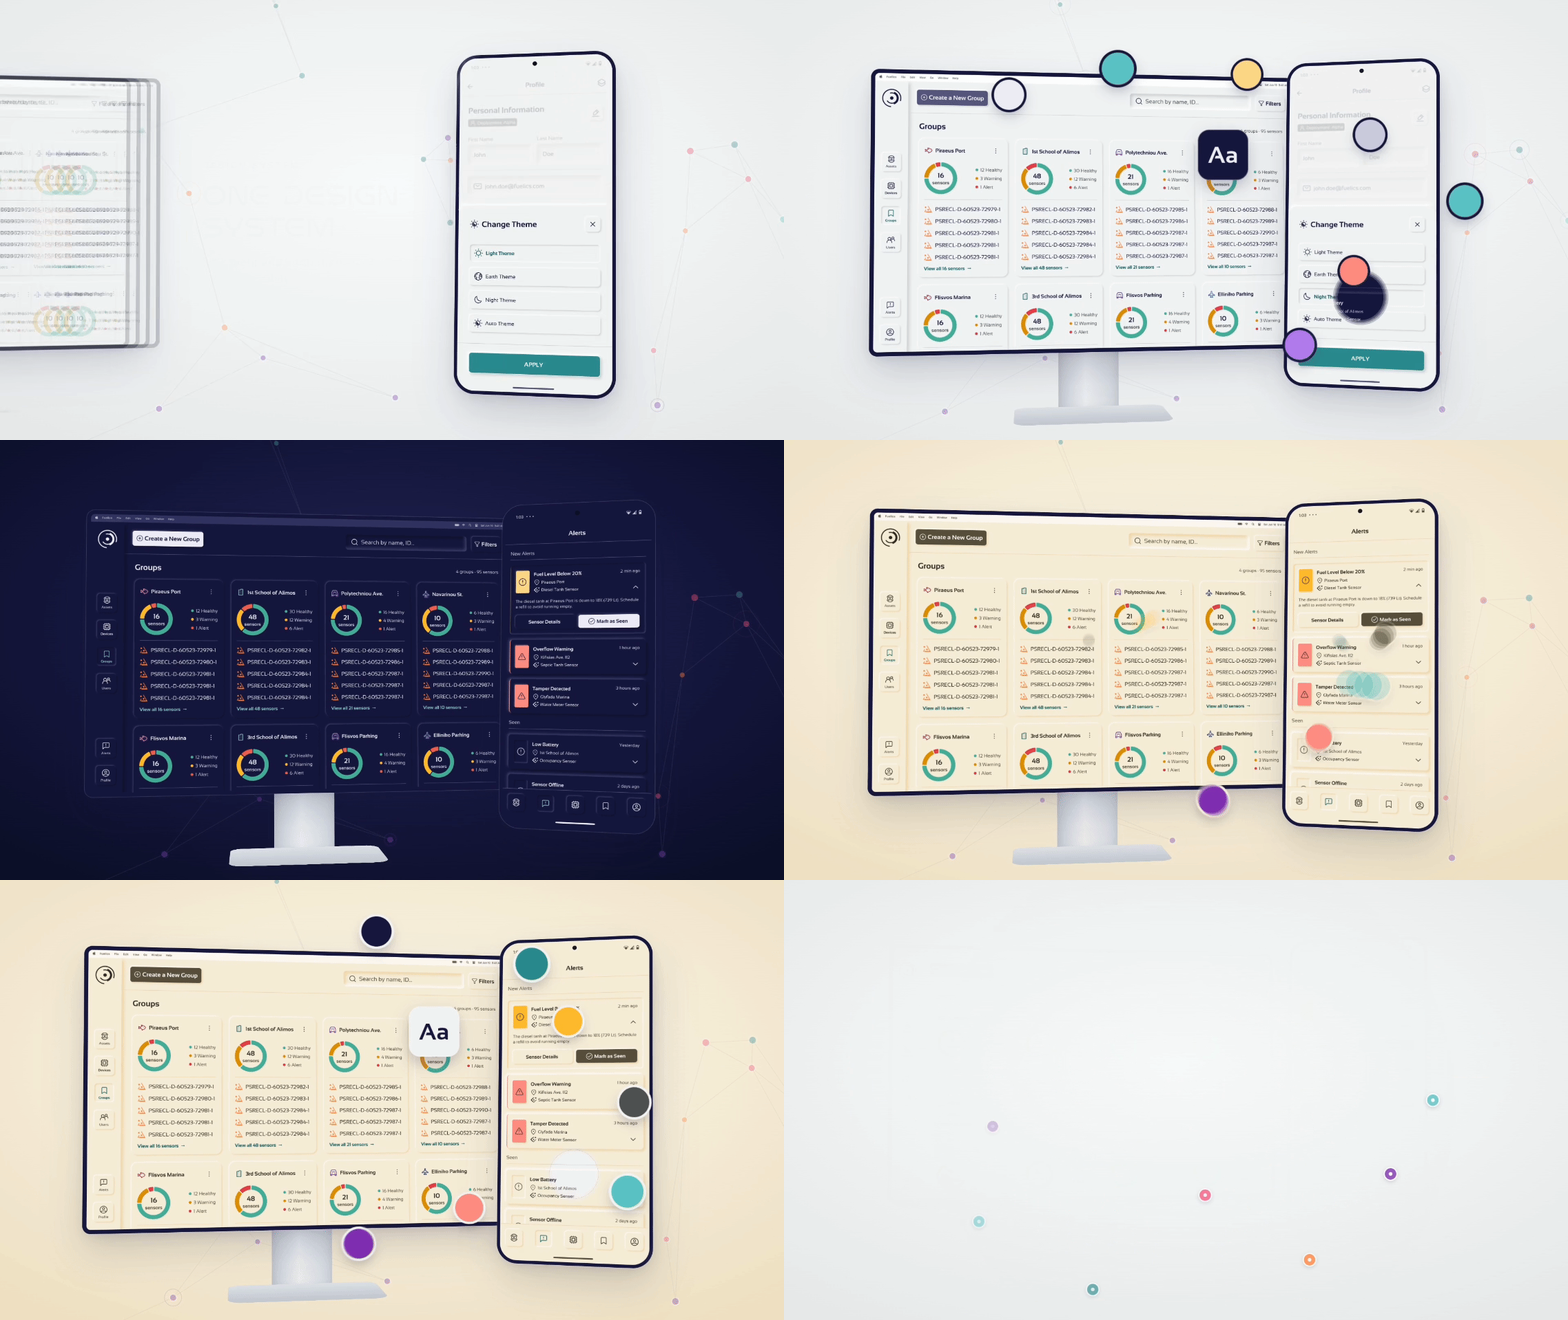
Consistency through every asset
Components, charts and map markers were designed for all three themes, so the product looks deliberate whatever the light or the operator’s preference.

Outcome
Within a year of launch, Fuelics grew to 2,000+ sensors for 70+ businesses in six countries, with one repeatable workflow for field setup. At a marina in Athens, live monitoring of water, fuel and parking helps prevent spills, leaks and congestion. At a food storage facility, humidity sensors caught a rainwater leak early, before mould could spoil the stock.


Wow, you made it this far?
Like what you see? Let's talk
